Console Overview
A guided tour of every section of the console. All screenshots were taken from a real running instance (version 0.0.1) connected to a live Apache Flink 2.x cluster.
Login
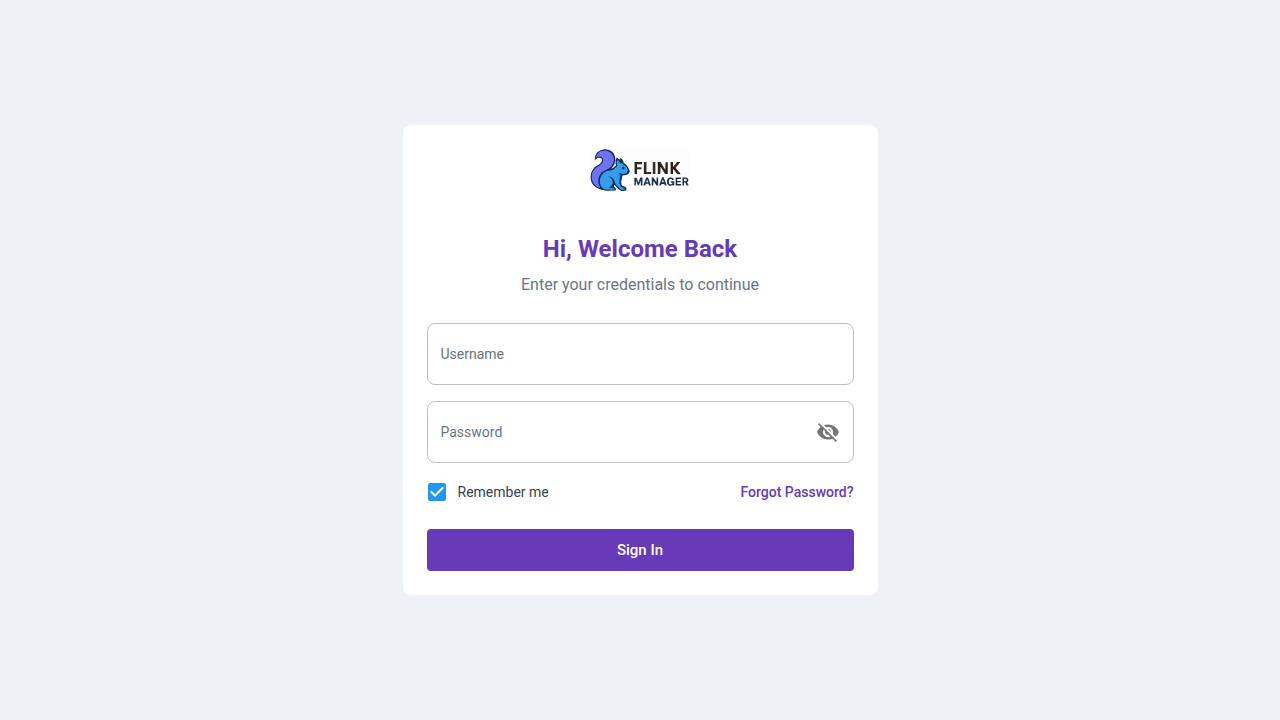
The entry point of the console. Sign in with a local account, or through an LDAP/OIDC authentication provider if one is configured (Configuration → Authentication).
License
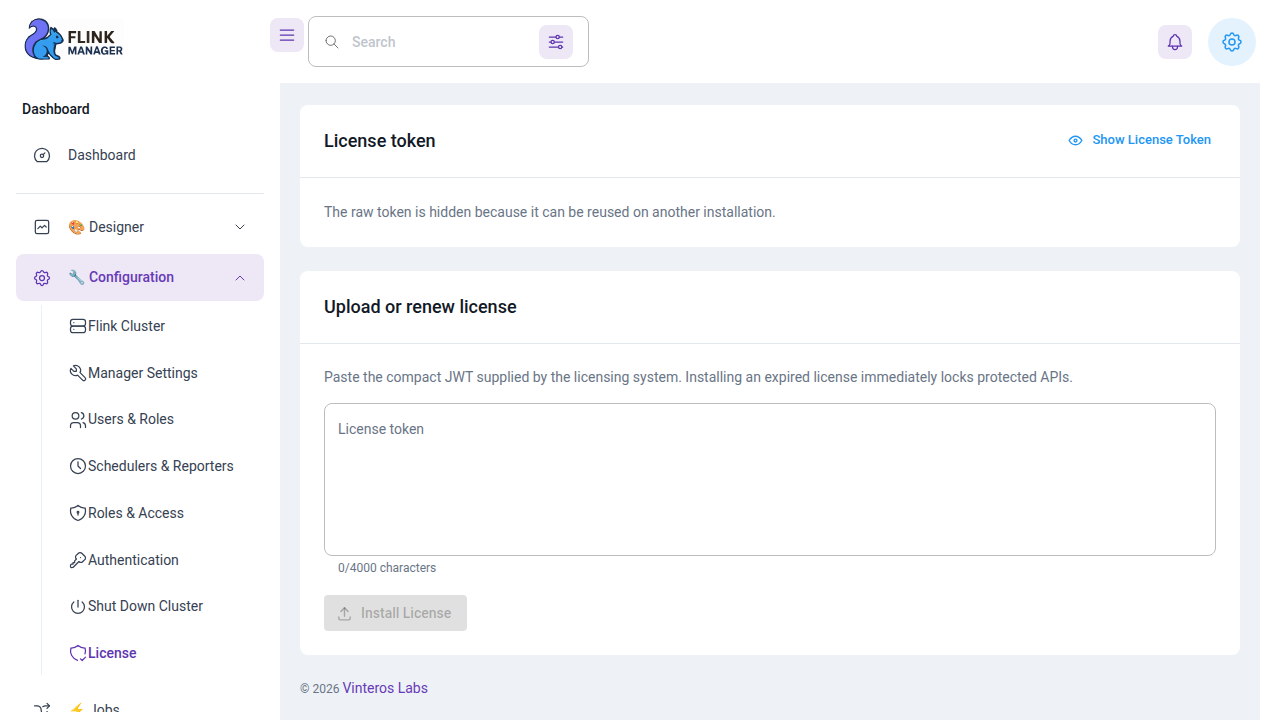
Once a valid token is installed, the status turns Valid and shows who the license was issued to, the expiry date and the days remaining. Until then the status shows Missing and protected operations are locked. See the License guide.
Flink cluster connection
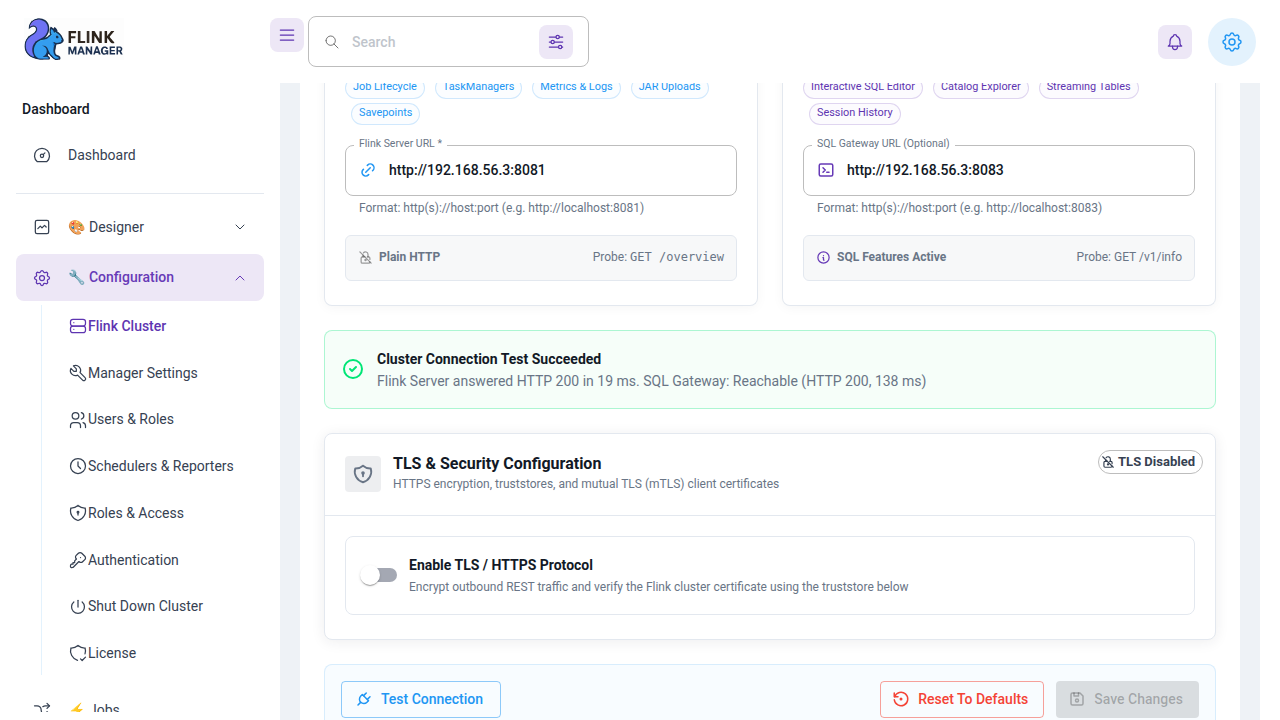
Configuration → Flink Cluster is where the JobManager REST endpoint and the (optional) SQL Gateway endpoint are set. Values saved here are stored in the database and take effect at runtime, without a restart. Test Connection probes both endpoints and reports reachability and response time.
Schedulers & Reporters
This page manages the background jobs that collect metrics and purge expired data. Three built-in schedulers ship with the product: metric-collector (polls the Flink REST API), reporter-metric-collector (pulls from JMX/Prometheus reporters) and cleanup-retention (purges expired rows). Each shows its interval, retention window and can be toggled active/inactive.
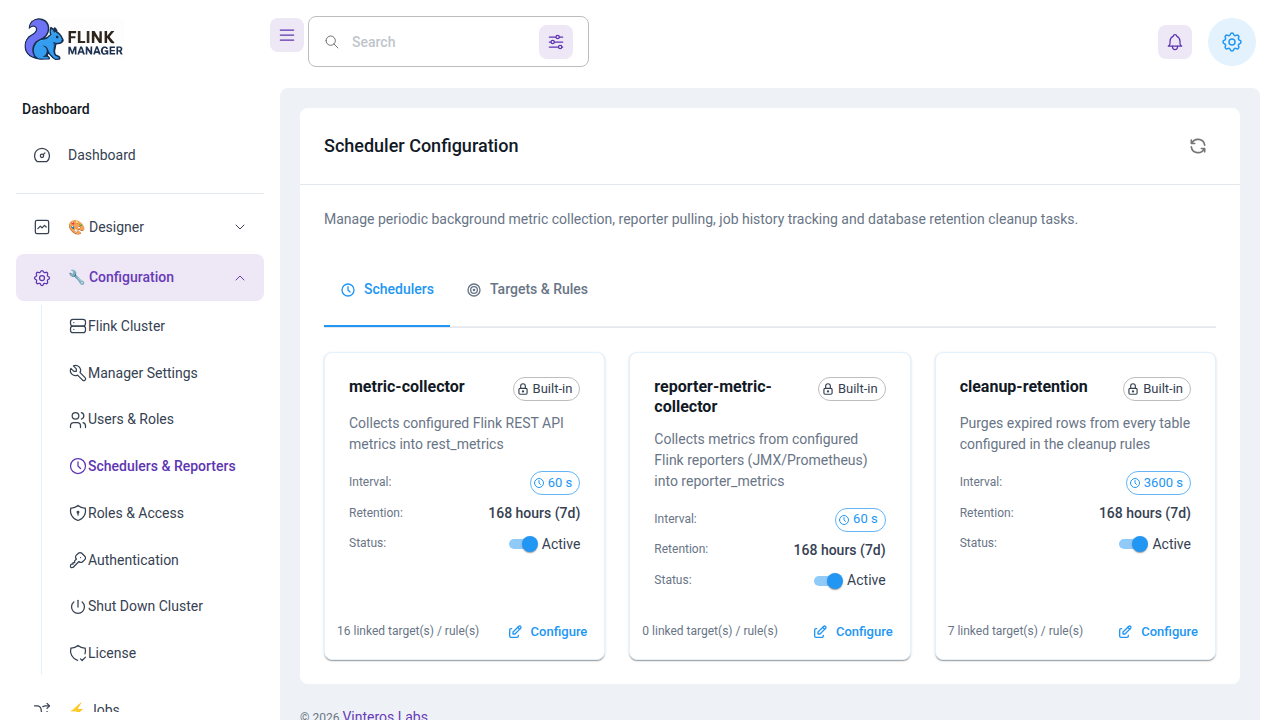
The Targets & Rules tab lists which metrics are collected — sixteen REST metric targets are preconfigured (jobs, slots, TaskManagers, JVM memory/CPU of the JobManager…), each linked to a scheduler and individually toggleable. The Reporter Targets tab is where you register your Flink cluster's JMX or Prometheus metric reporters so the manager can pull their data.
Users & Roles
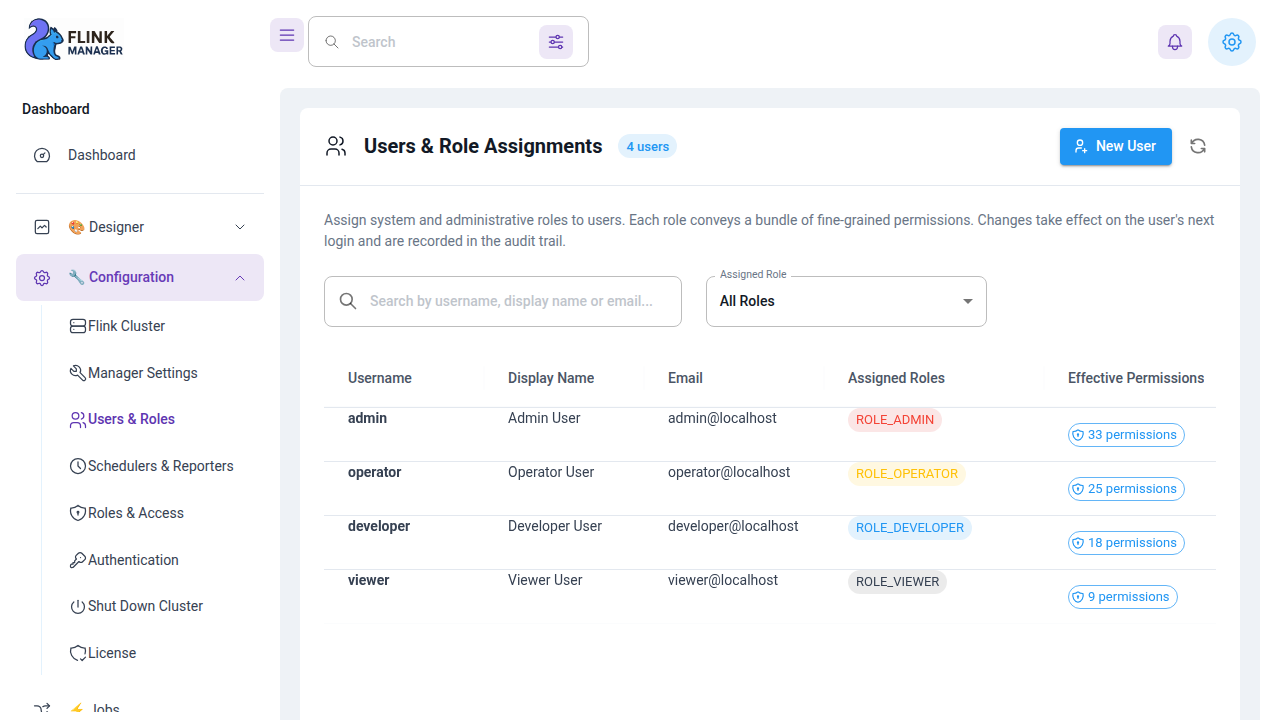
Configuration → Users & Roles assigns system roles to users. Four accounts are seeded on first start (admin, operator, developer, viewer) — one per built-in role. Creating a user shows a live effective-permissions preview of exactly what the selected role grants, and the action is recorded in the audit trail.
JAR management
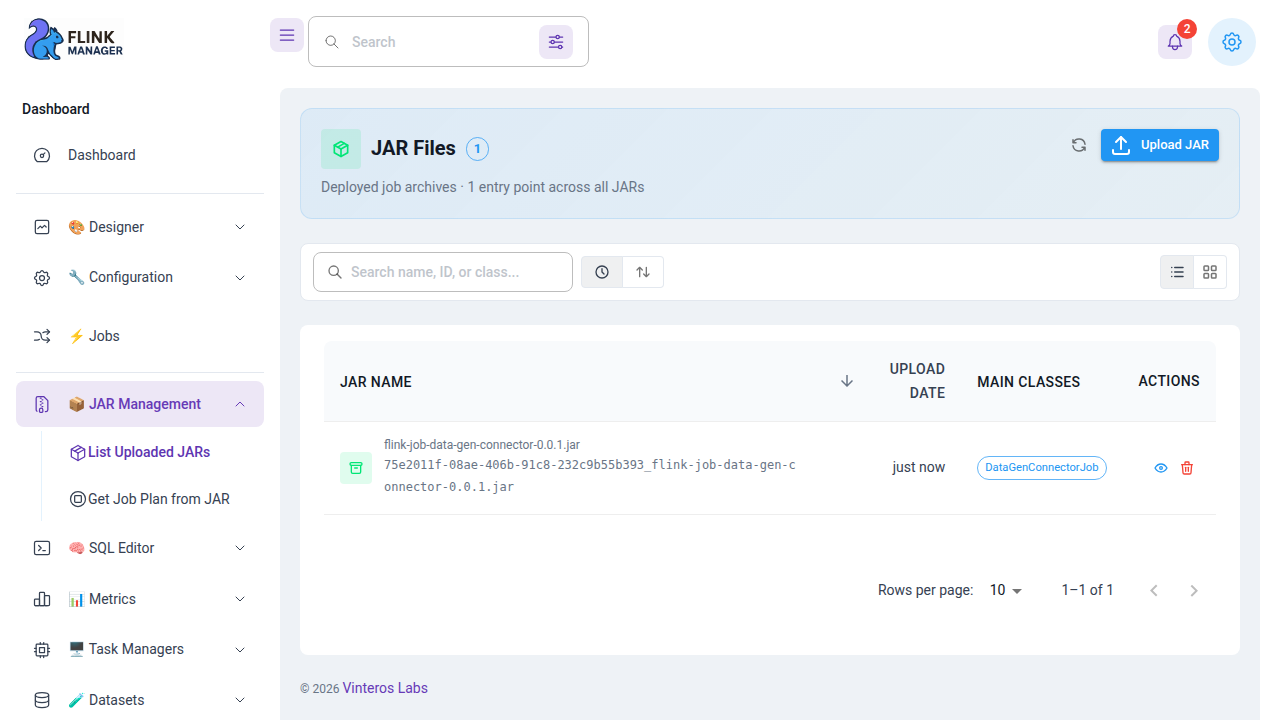
JAR Management lets you upload job JARs (up to 100 MB via a drag-and-drop dialog), list, delete and run them. After upload the JAR is registered on the cluster with its detected entry point.
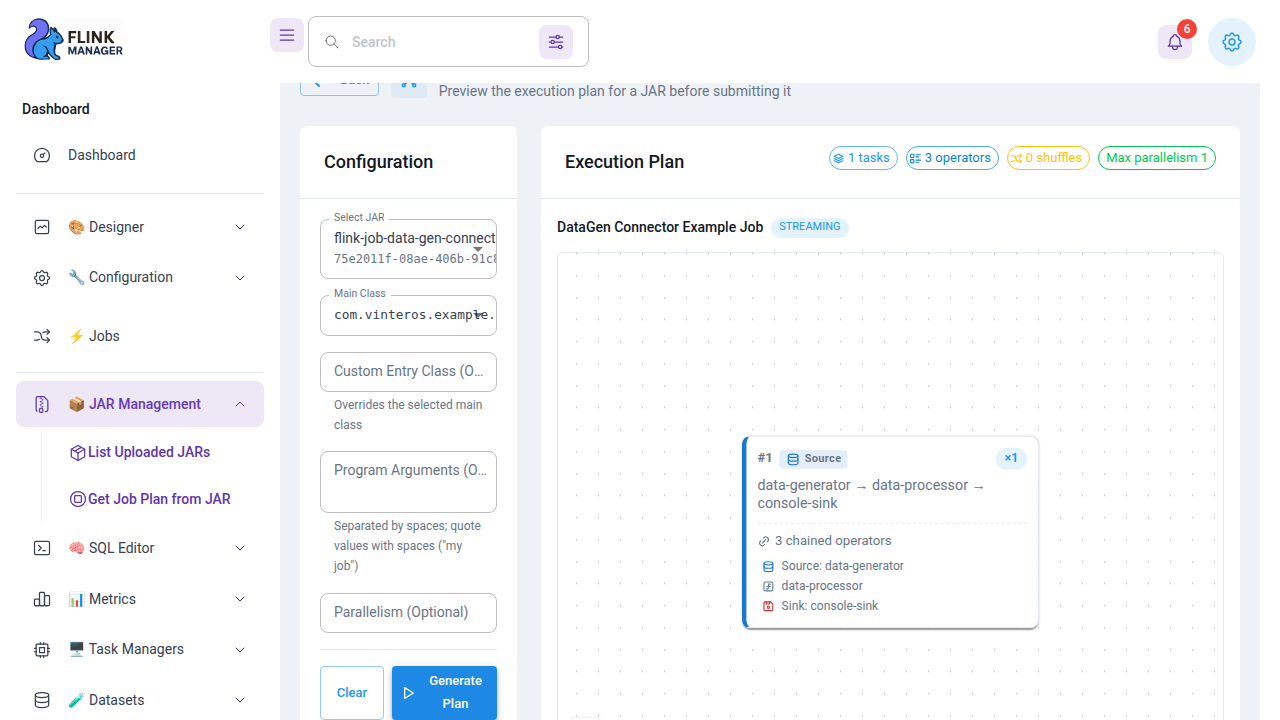
Get Job Plan from JAR previews how Flink will execute a JAR before submitting it: pick the JAR and its main class, and the generated plan summarises the topology (tasks, operators, shuffles) and draws the execution graph.
Jobs
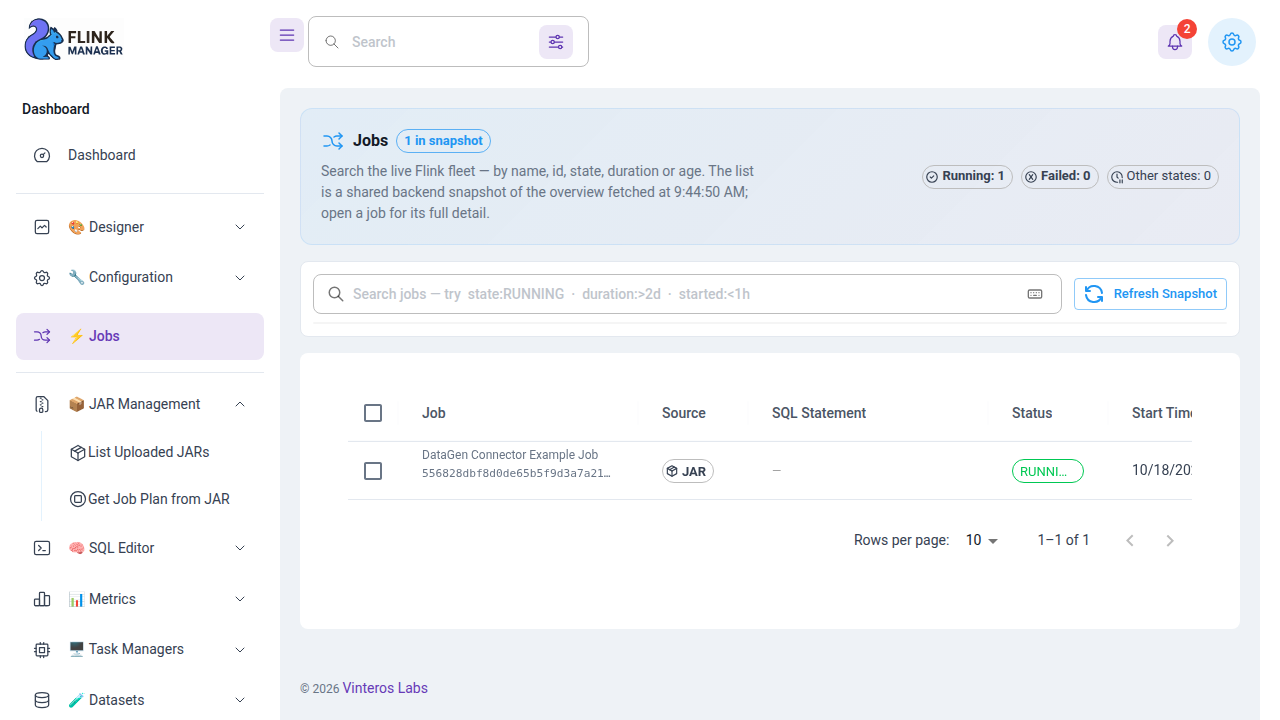
From the JAR details page, the Run Job form takes the entry class, a job name, parallelism and program arguments; a confirmation dialog shows exactly what will be submitted to the cluster. Jobs appear in the jobs list with a RUNNING status and a JAR source badge.
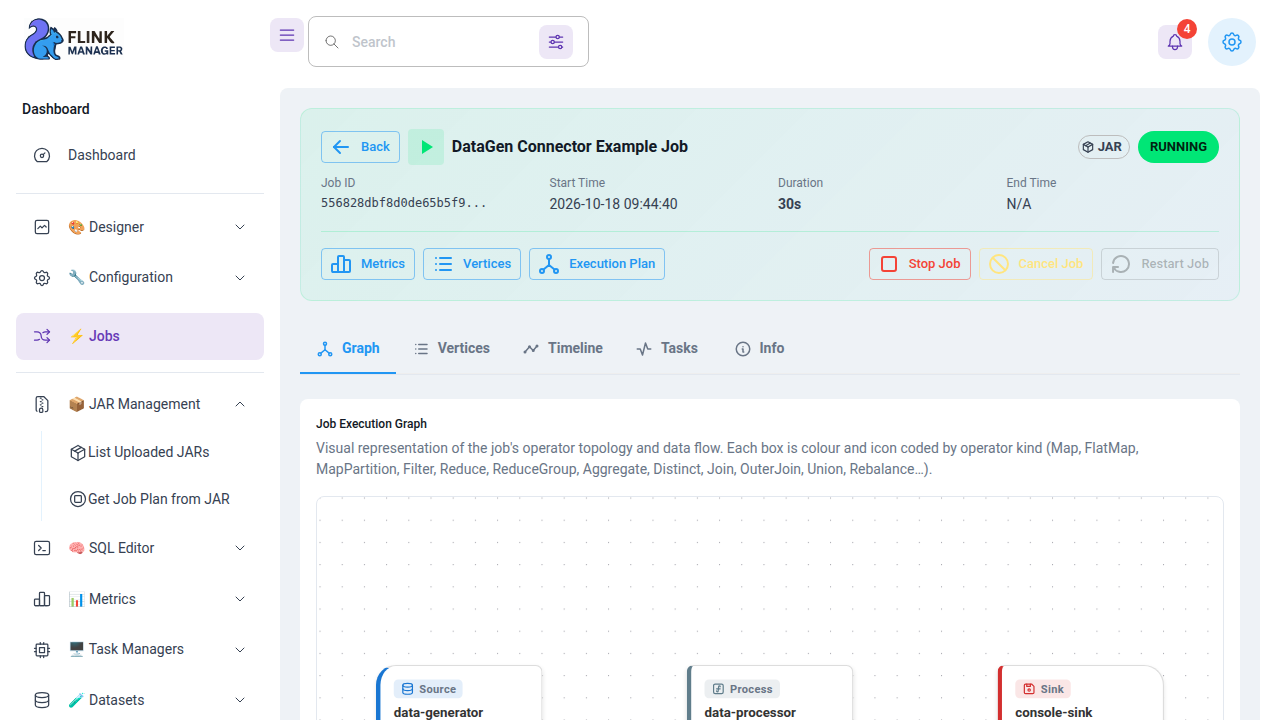
The job detail page shows live status, duration and the action toolbar (Metrics, Vertices, Execution Plan, Stop, Cancel, Restart). The Vertices tab breaks the job down per operator with per-vertex metrics. Job run / stop / restart support savepoints, with a configurable savepoint directory and drain/format defaults.
SQL editor
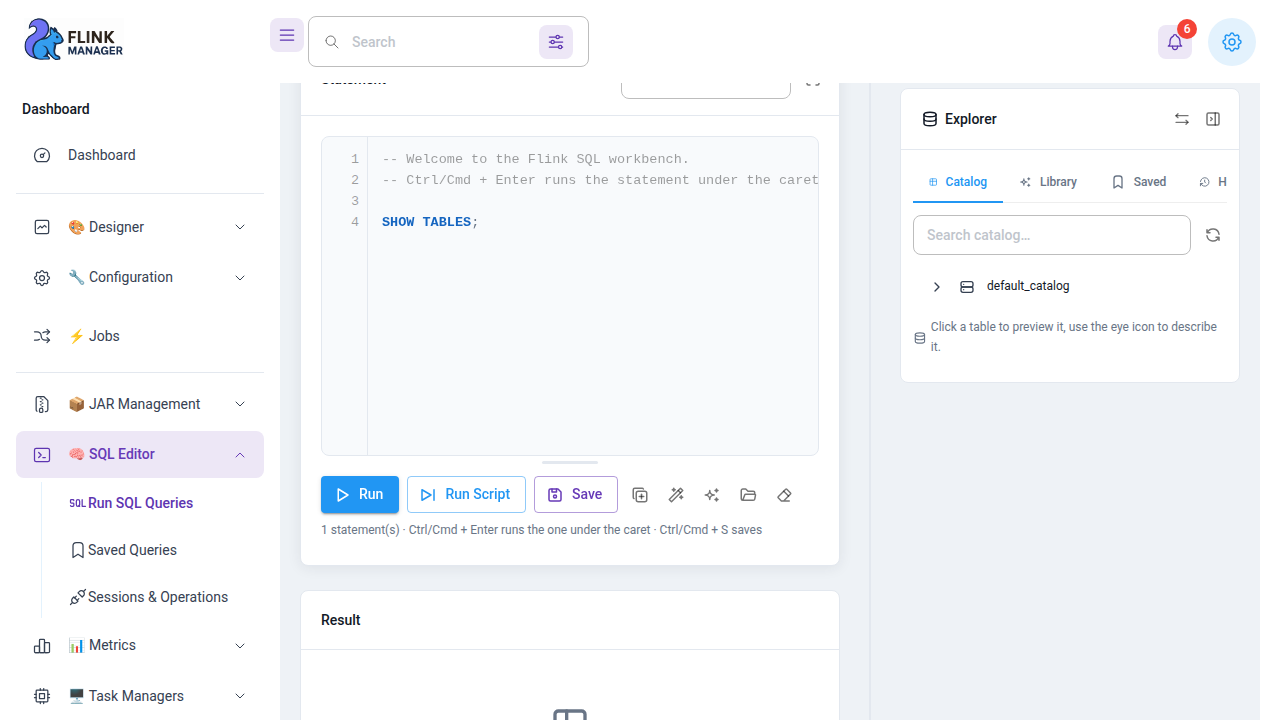
The SQL workbench is backed by the Flink SQL Gateway (optional — disabled until a gateway endpoint is configured). Statements run against named sessions: open a session from Sessions & Operations, then pick it in the editor and browse catalogs and tables in the explorer on the left.
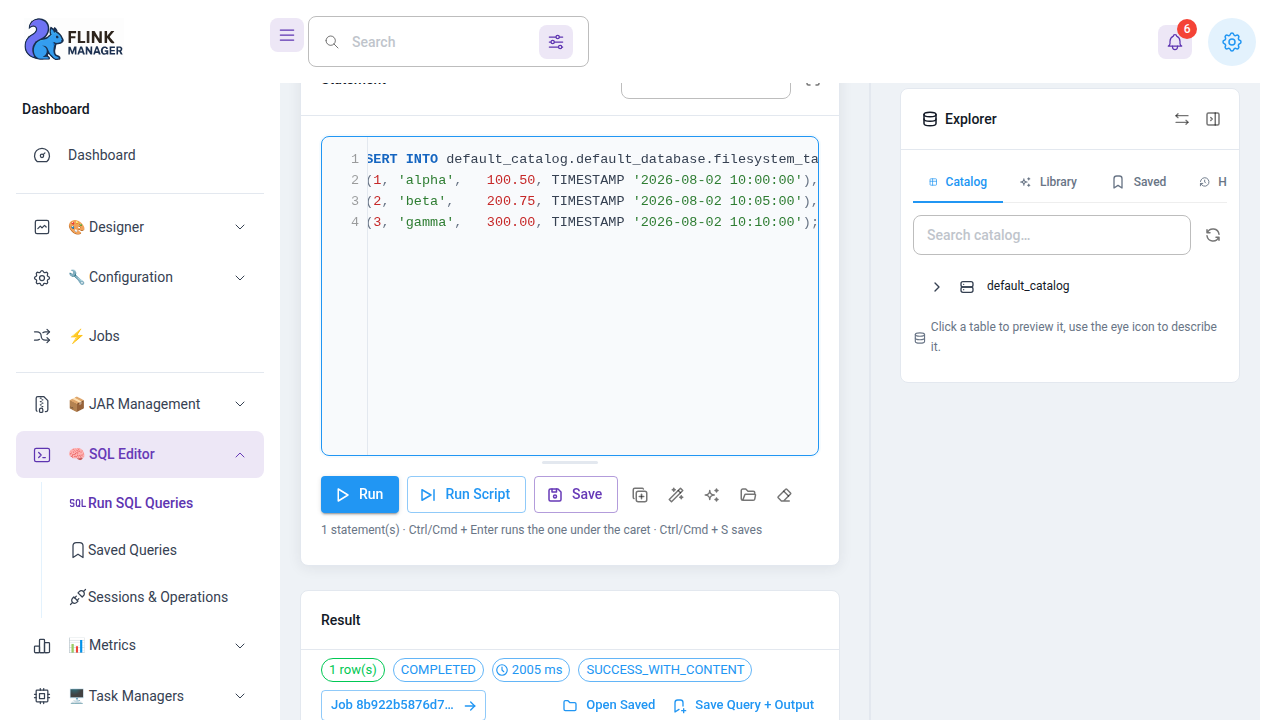
DDL runs directly — a CREATE TABLE registers a table and the result panel reports duration with Results / Schema / Raw JSON tabs. An INSERT INTO submits a real Flink job: the returned job id appears in the jobs list with a SQL source badge and the originating statement. Saved queries, session & operation history and query history are all kept.
Metrics
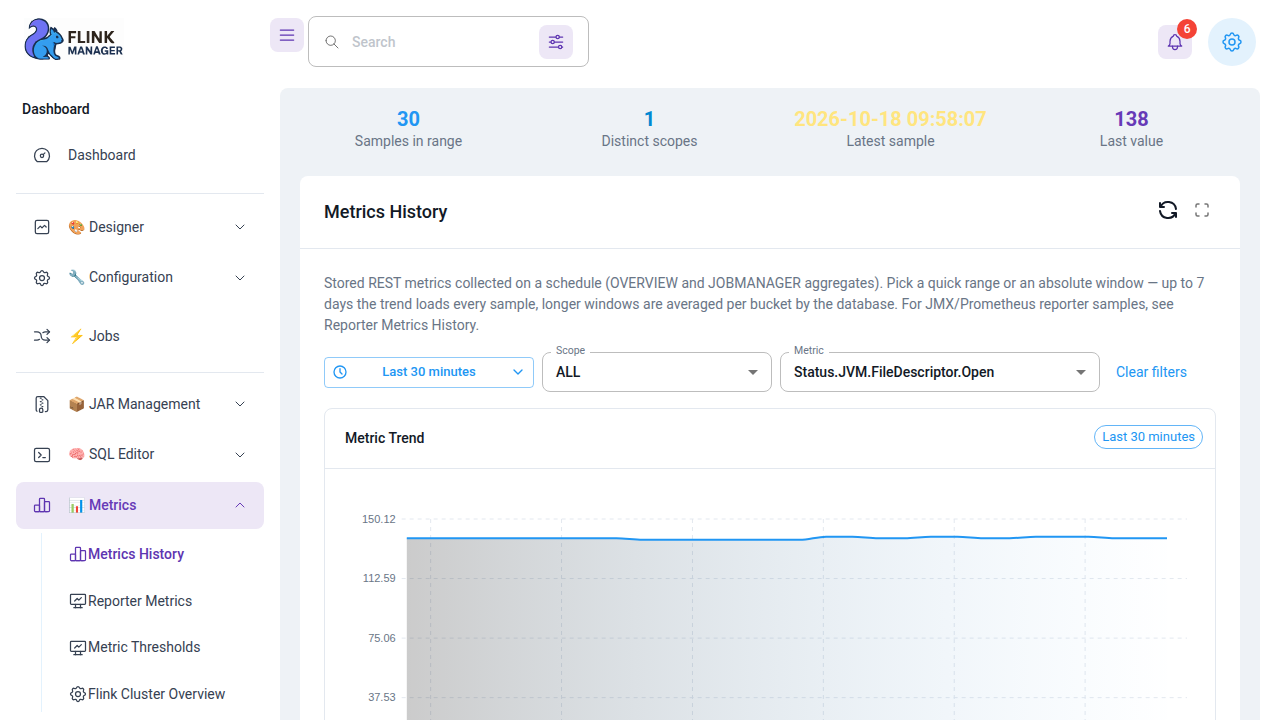
Metrics History charts the REST metrics collected by the metric-collector scheduler, with filters by scope and metric and a brush to pan and zoom the window. Reporter Metrics derives cluster health from the JMX or Prometheus reporters: an Overview with health widgets, an Explorer of raw collected metric families, Charts, and Raw rows.
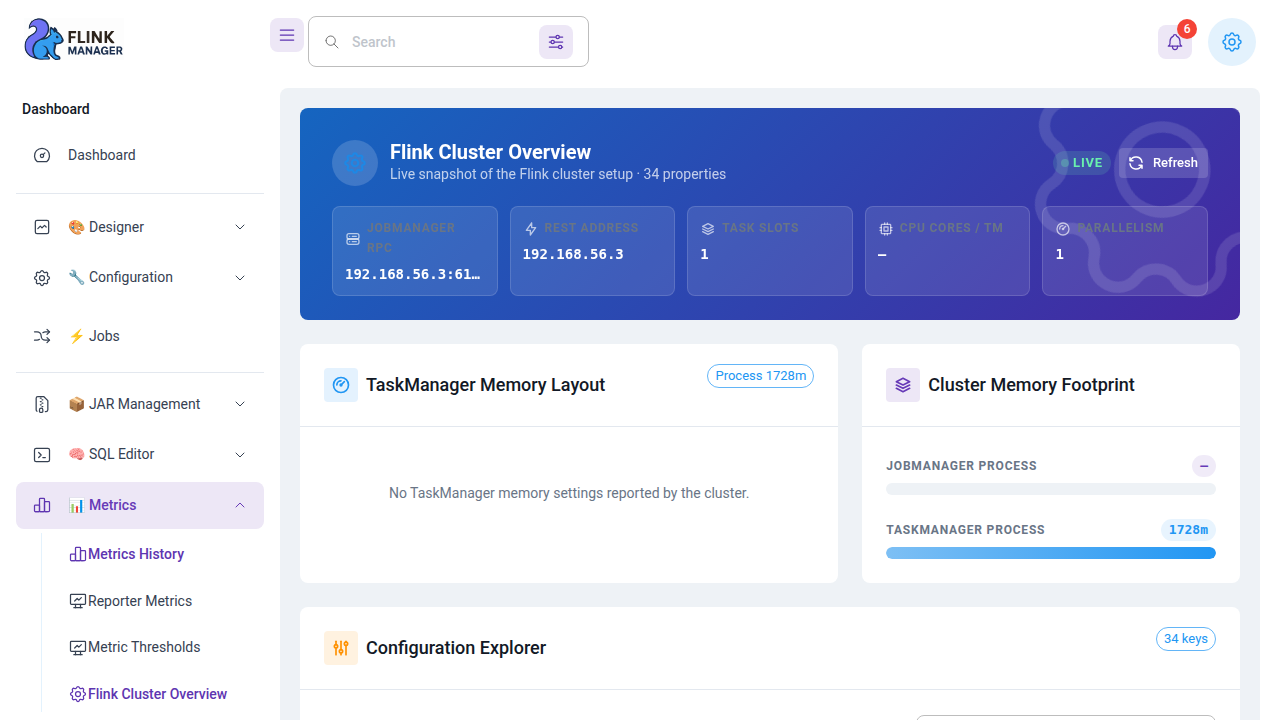
Metric Thresholds curates the metric dictionary — the warning/critical thresholds edited here drive the health widgets on the Reporter Metrics Overview. The Flink Cluster Overview is a live dashboard of cluster-wide metrics.
TaskManagers
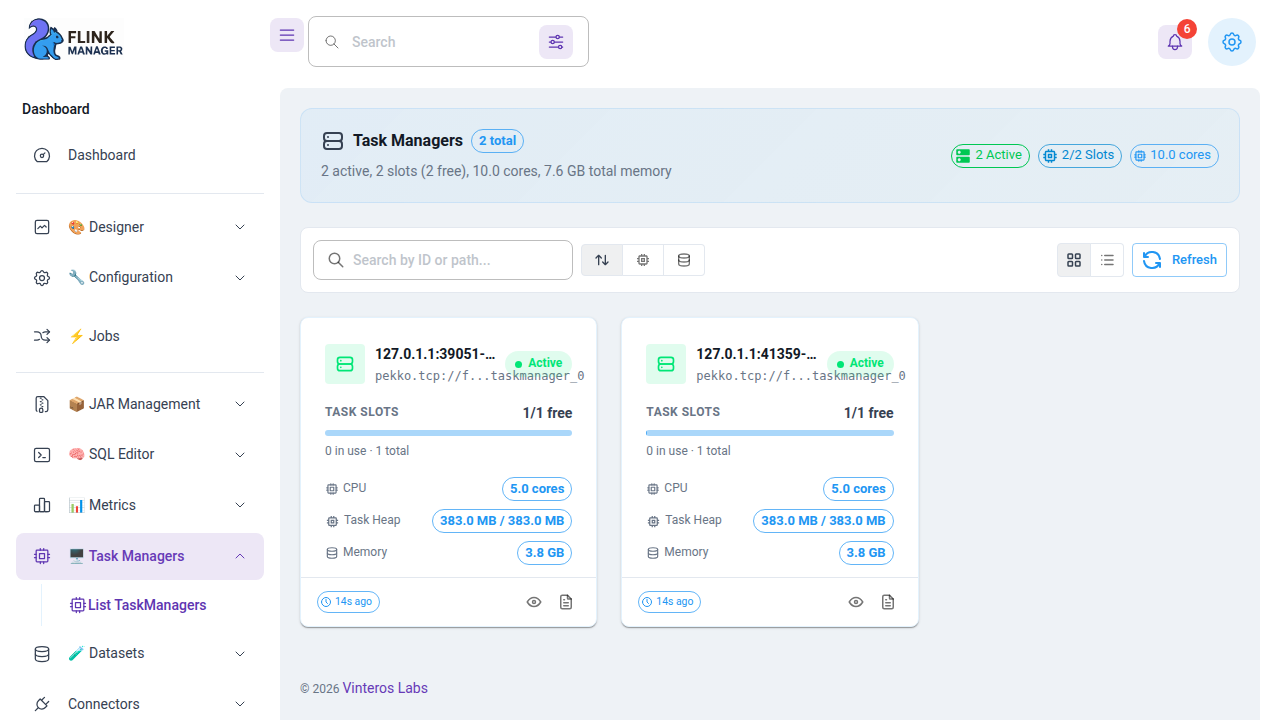
The TaskManagers list shows every worker with its slots, CPU cores, task heap and memory, plus a summary strip for the whole cluster. The detail page exposes data port, JMX port, hardware, slot information and the full memory configuration. View Logs opens the TaskManager's log files directly in the browser — no SSH needed.
Audit
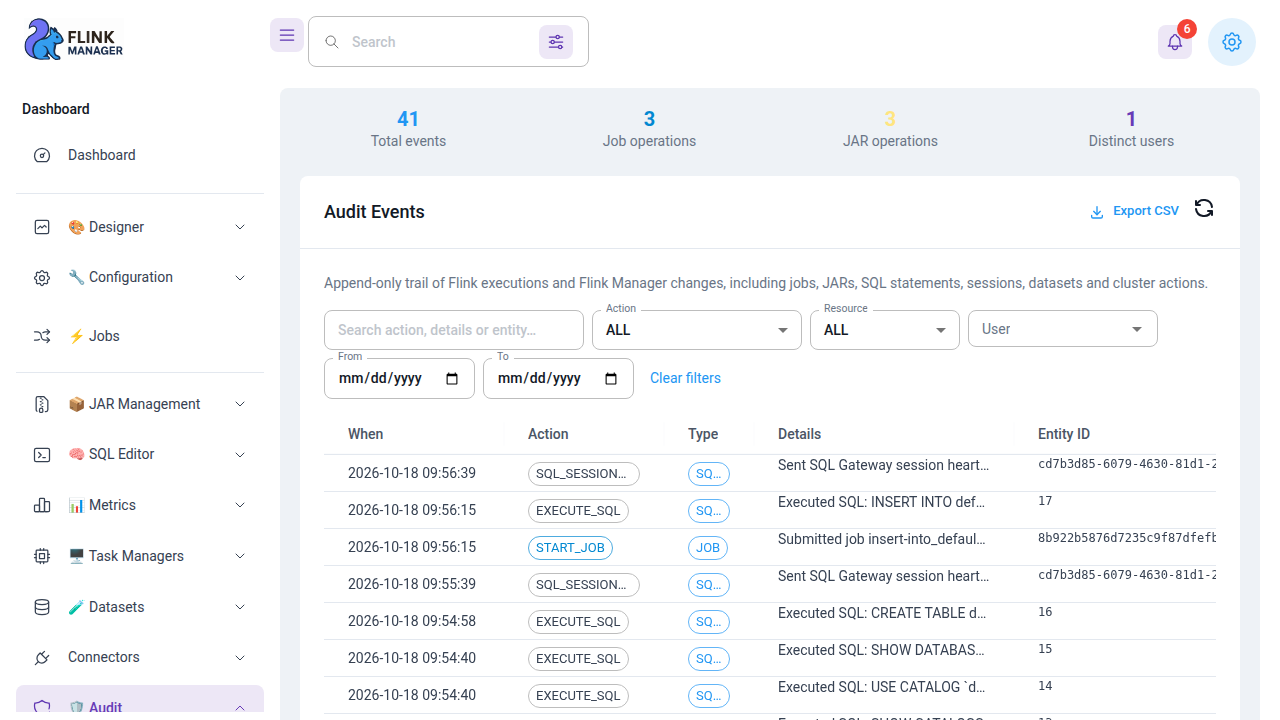
Audit Events is an append-only trail of everything done through Flink Manager — job operations, JAR uploads, SQL statements, user and configuration changes. Filter by action, resource, user and date range, and export to CSV. Job History keeps job lifecycle records beyond the Flink cluster's own retention, SQL Query History records every statement executed from the editor, and JAR History tracks upload activity.
Datasets & Connectors
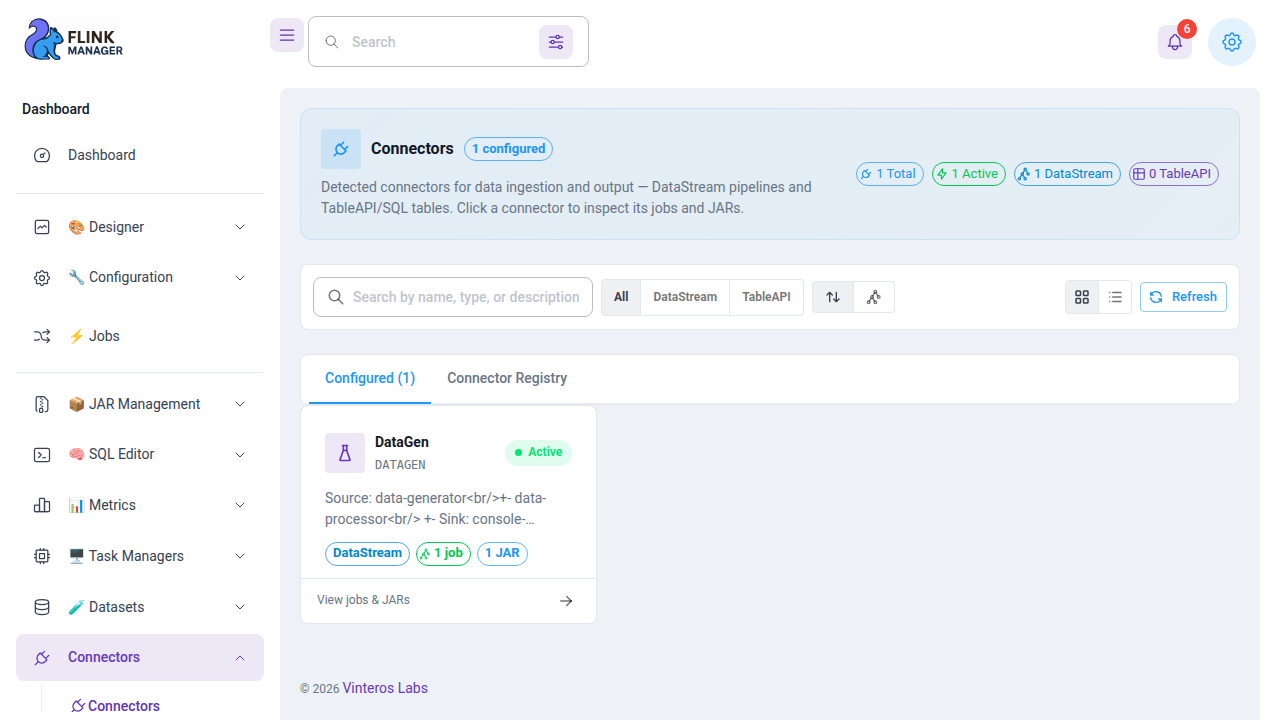
Datasets manages cached datasets with add, refresh and delete operations. Connectors detects the connectors in use across DataStream pipelines and Table API/SQL tables, with a Connector Registry tab listing the connector types available on the cluster.
Flow Designer
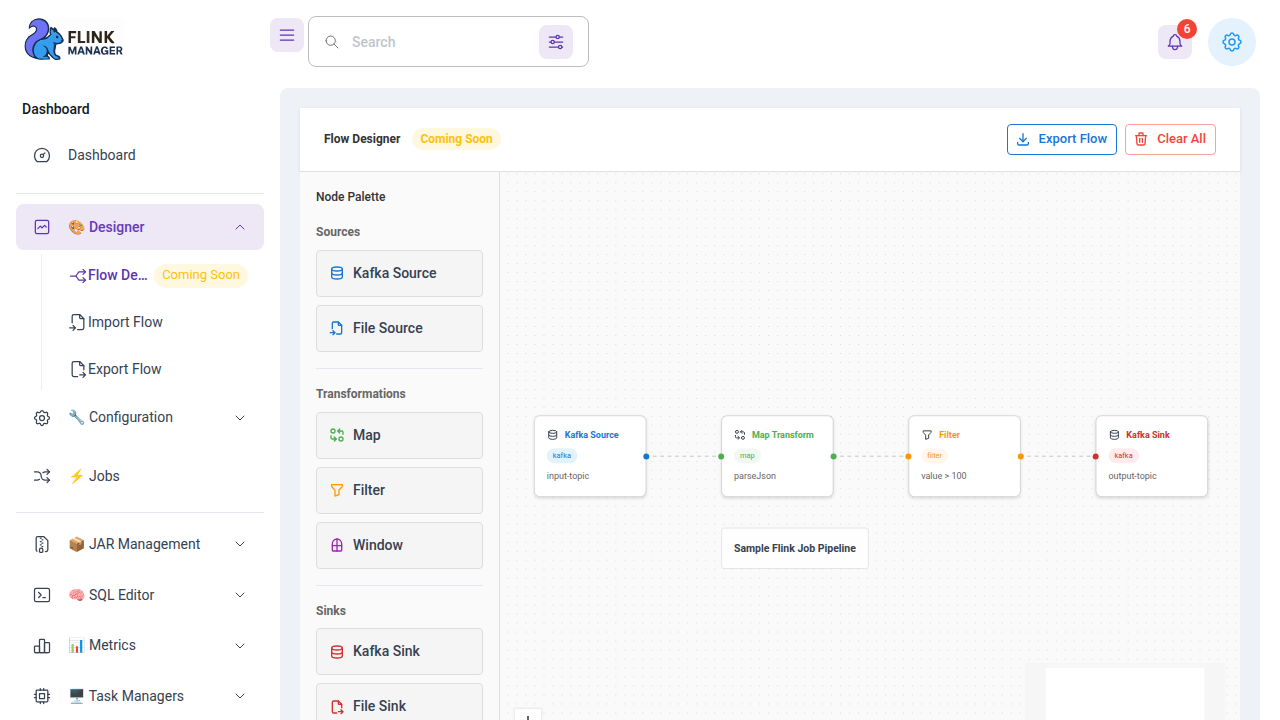
The Flow Designer is a visual editor for building pipelines from a palette of sources (Kafka, File), transformations (Map, Filter, Window) and sinks (Kafka, File, Print). Flows can be imported from a file and exported for backup or sharing between environments.